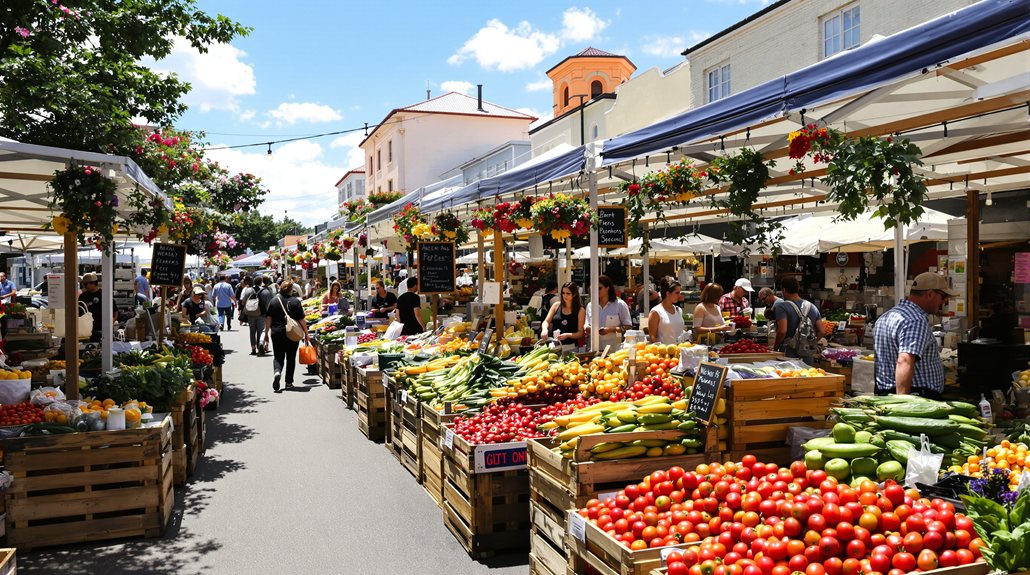
Before committing to a booth, you need to know a market pulls at least 300 weekly shoppers to break even on a $50 fee. Count entrants at the entrance for 30 minutes on a regular Saturday, then double it for your hourly estimate. Ask an existing vendor whether shoppers actually buy specialty food or mostly browse. The numbers you find next will change which markets you target first.
Key Takeaways
- Markets with fewer than 300 consistent weekly shoppers make breaking even on a $50 booth fee extremely difficult for specialty vendors.
- Stand at the entrance for 30 minutes on a regular Saturday and multiply the count by two to estimate hourly traffic.
- Year-round markets generate steadier repeat buyers; seasonal markets often see 30–50% fewer shoppers by late summer and fall.
- A repeat buyer rate above 40% signals a food-literate, loyal customer base worth prioritizing over raw foot traffic numbers.
- Use MGW Market Finder at markets.microgreensworld.com to compare at least three USDA-verified markets side by side before applying.
What is a good amount of foot traffic for a farmers market booth?
Most vendors pick a market based on location and booth fee. They skip the one number that actually tells you if the market can support your business.
You need a minimum customer count to cover costs, and high-performing markets hit numbers that make that target easy to reach.
How to calculate the minimum customer count you need to cover booth costs
Start with the booth fee. If you’re paying $50, you need to cover that before you profit.
At an average transaction of $8 to $12, you need 5 to 7 sales just to break even.
That’s not enough. You also need to account for supplies, transport, and your time.
A realistic break-even target is 10 to 15 transactions minimum.
Now check the farmers market foot traffic numbers. A market with fewer than 300 weekly shoppers makes those 15 sales harder to hit.
You’re not just counting bodies. You’re counting buyers who match your product.
Specialty microgreens don’t convert at every market. Know the shopper profile before you commit.
What high-performing markets actually see on a Saturday morning
High-performing markets don’t start at 300 shoppers. That number is your floor, not your target.
Urban markets with strong reputations pull 1,000 to 20,000 farmers market weekly shoppers every Saturday. The Portland Farmers Market at PSU sees 10,000 to 12,000 shoppers per week during peak season.
Those numbers aren’t flukes. They come from years of community trust and consistent vendor quality.
You want to be in that environment. Vendors who sell specialty crops do better when the crowd already expects variety and quality.
If a market is pulling 800 or more consistent weekly shoppers, that’s a viable target. Below 500, you’re gambling with your booth fee and your Saturday.
How do you measure farmers market foot traffic before you apply?
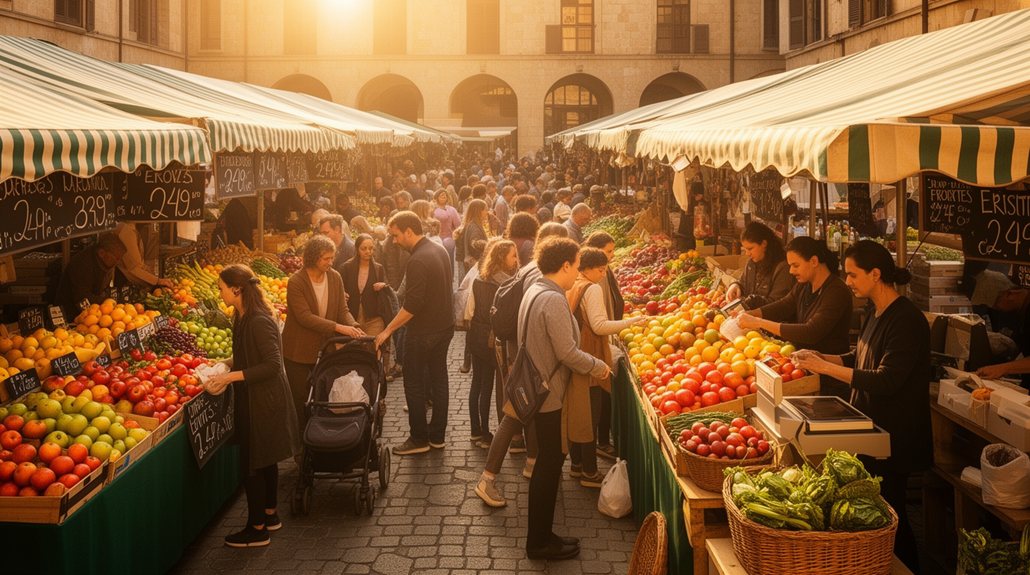
You don’t have to guess at foot traffic. You can measure it yourself before you pay a single booth fee.
Two methods give you the numbers you need: a timed count at the entrance and a direct conversation with a vendor already working that market.
The Saturday visit method for counting and evaluating market traffic
Visit the market on a regular Saturday morning. Skip opening day and any special events. Those numbers won’t reflect a typical week.
Stand at the entrance for 30 minutes. Count every person who walks in. Multiply that number by 2 to estimate hourly traffic.
That’s your farmers market traffic count baseline.
| Time window | People counted | Estimated hourly traffic |
|---|---|---|
| 8:00–8:30 AM | 95 | 190 |
| 9:00–9:30 AM | 140 | 280 |
| 10:00–10:30 AM | 110 | 220 |
| 11:00–11:30 AM | 75 | 150 |
| 12:00–12:30 PM | 45 | 90 |
Peak hour matters most. That’s when your booth needs to convert.
What to ask vendors at the market that foot traffic numbers will not tell you
After your count, walk the floor and talk to vendors. Pick someone who sells something different from microgreens. A bread baker or jam seller works.
Ask them one direct question: “How many repeat customers do you see each Saturday?” That answer tells you what your farmers market vendor foot traffic research can’t show you from the entrance.
Ask a second question: “Do shoppers here actually buy specialty food, or mostly browse?”
A high count means nothing if the crowd isn’t buying. Vendors who’ve worked a market for two or more seasons know which Saturdays convert and which don’t. Their experience compresses months of data into a five-minute conversation.
Does market type affect how consistent foot traffic is throughout the season?
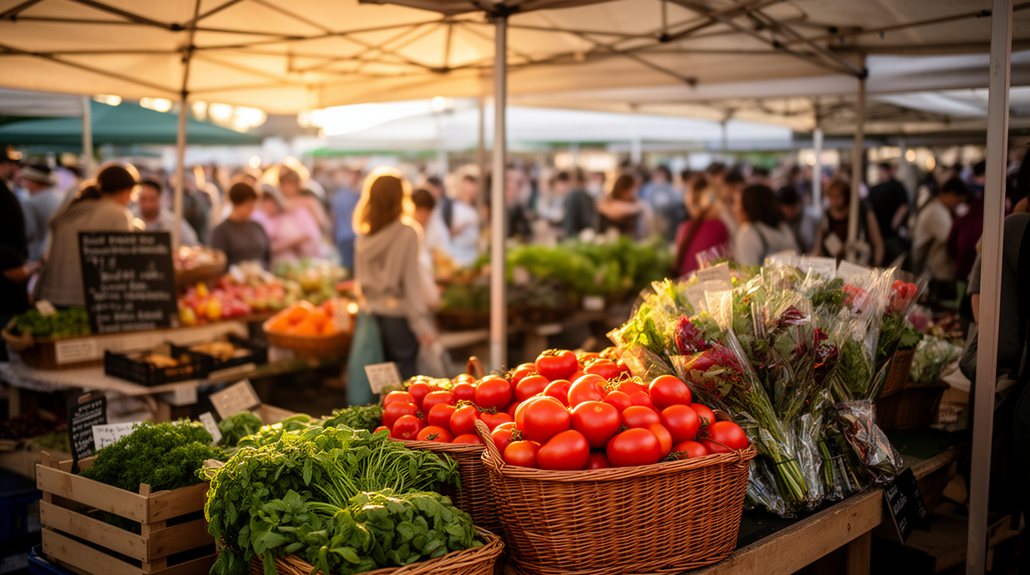
Market type directly affects how consistent your foot traffic is week to week. Year-round markets build loyal weekly shoppers, and that repeat traffic is more predictable than seasonal spikes.
Seasonal markets often see strong early-season numbers, but traffic drops in late summer and fall.
Why year-round markets build steadier weekly traffic than seasonal ones
Year-round markets almost always outperform seasonal ones on traffic consistency. Shoppers build weekly habits at markets they can count on every Saturday.
That habit is what drives repeat buyer rates. Seasonal vs year-round farmers market traffic data shows the gap is real. Seasonal markets spike early, then drop in late summer as novelty fades.
Year-round markets don’t spike. They compound. Customers show up because the market is part of their routine, not their calendar.
If you’re evaluating a new market, check how many months it operates. A market open 52 weeks develops a loyal shopper base. That base converts better for specialty vendors selling microgreens at $8 to $12 per transaction.
What happens to traffic at seasonal markets in late summer and fall
Seasonal traffic drops off hard once August hits. Shoppers who showed up in May and June stop coming. That’s the pattern at seasonal markets across the country.
Seasonal markets have traffic spikes early in the season and drops in late summer and fall. Opening weekends pull curious crowds. By late August, those same markets see 30 to 50 percent fewer shoppers.
That drop hits your sales before you see it coming. You’re still paying the same $50 booth fee. The crowd just isn’t there anymore.
Other vendors at your market have already tracked this. Ask a non-competing vendor what their average count looks like in September compared to May. That one conversation tells you what the calendar doesn’t.
Does high foot traffic always mean high sales for specialty crop vendors?
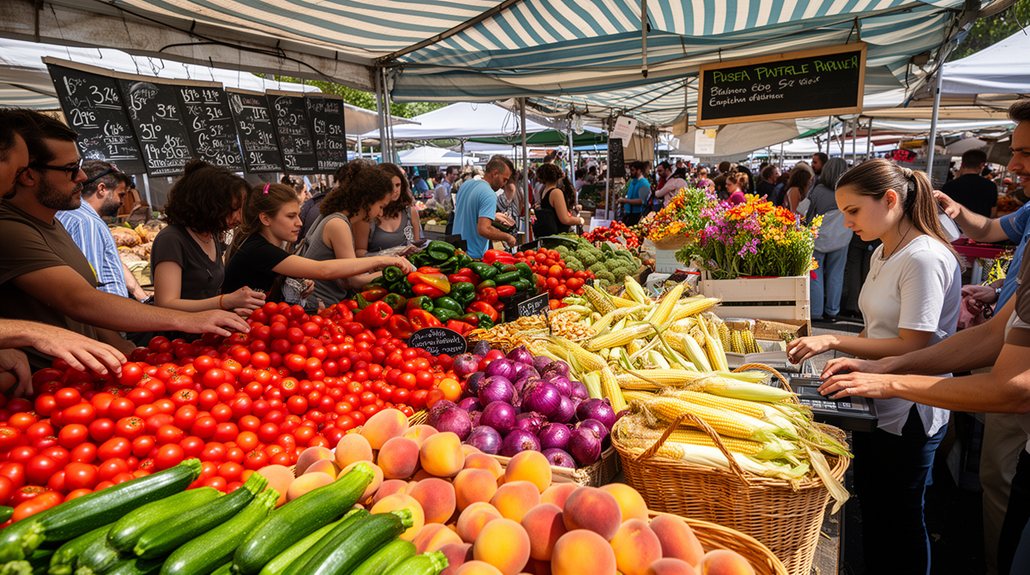
High foot traffic doesn’t guarantee high sales for specialty crop vendors. A tourist market and a food-literate neighborhood market can pull identical weekly numbers, but your conversion rate will be completely different.
Customer quality matters as much as customer quantity.
Why a tourist market and a neighborhood market can have identical traffic but different results
Two markets can pull 2,000 shoppers on a Saturday and produce completely different sales results for a microgreens vendor.
A tourist market draws visitors once. They’re not building a weekly shopping habit. They’re buying a souvenir snack, not a $10 bag of specialty greens they’ll cook with on Tuesday.
A neighborhood market draws regulars. Those shoppers come back. They learn your name, your product, and your growing method. That repeat behavior is what builds a real farmers market customer count that converts.
The raw number looks identical on paper. The buying behavior is not.
When you visit a market before committing, watch who’s shopping. Ask vendors who their repeat buyers are. Tourist foot traffic and food-literate foot traffic aren’t the same thing.
What customer quality means versus customer quantity
Foot traffic is a count. It tells you how many people walked in. It doesn’t tell you who they’re or what they buy.
A market with 8,000 weekly shoppers sounds promising. But if 6,000 of them are tourists grabbing coffee and photos, your $10 sunflower shoots won’t move.
Customer quality means food-literate buyers. These are repeat shoppers who plan their weekly groceries around the market. They’re your people.
Ask a vendor at the market how many of their Saturday customers come back the following week. A repeat rate above 40% signals a loyal base.
That loyalty is what makes a farmers market worth it. High foot traffic without food-literate buyers is just noise.
How do you find high-traffic markets near you before you commit?
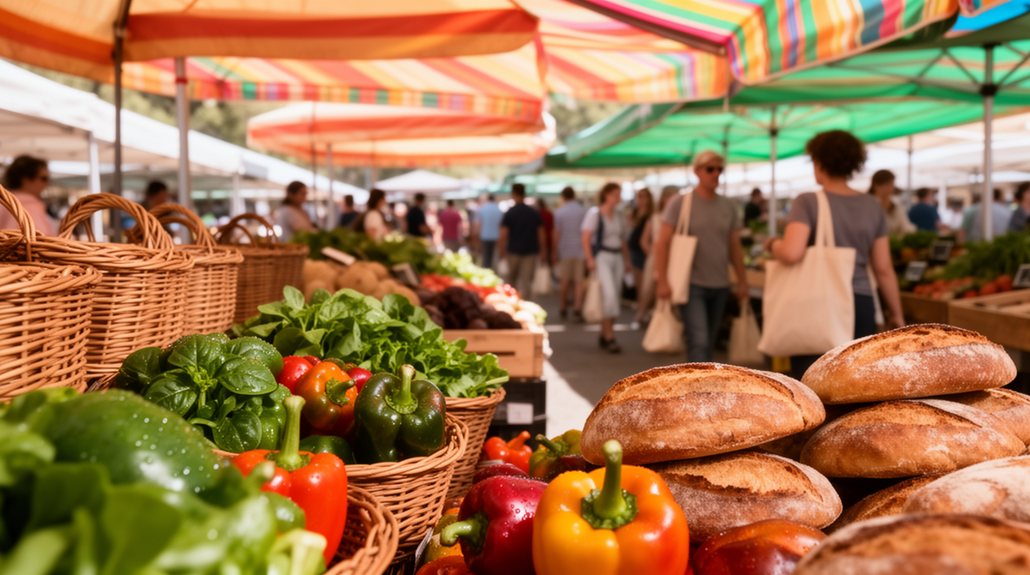
You can’t judge a market by its listing alone.
Market size and format are the first filters that tell you whether a location is worth your time. The MGW Market Finder gives you USDA-verified data on 7,842 markets so you can sort by location before you ever visit one.
What market size and format data shows about likely traffic levels
Market size and format tell you more than vendor count or booth fees. A 20-vendor neighborhood market serving a food-literate zip code often outperforms a 100-vendor fairground market for specialty crops.
How many customers does a farmers market get? It depends on format. Year-round markets build repeat buyers. Seasonal markets spike early and drop by August.
Urban year-round markets are your benchmark. The Saturday Portland Farmers Market at PSU pulls 10,000 to 12,000 shoppers per week at peak. That’s the ceiling.
Under 300 weekly shoppers means low conversion potential for a $50 booth. Format tells you which direction traffic trends. Size alone doesn’t.
How to use the MGW Market Finder to identify the right market type
Three searches tell you more than a dozen cold calls ever will.
The MGW Farmers Market Finder covers 7,842 USDA-verified markets. Search by your zip code first. That gives you every market within reach.
Filter by market type next. Year-round markets show more consistent foot traffic than seasonal ones. That consistency matters when you’re learning how to evaluate farmers market foot traffic at each location.
Compare at least three markets side by side. Look at operating days, season length, and location type.
The MGW Farmers Market Finder has 7,842 USDA-verified markets searchable by zip code, city, or state. Employ it to find and compare markets near you before you apply – markets.microgreensworld.com.
The Microgreens Growth Path Tool maps your first move using local market data – growthpath.microgreensworld.com.
Frequently Asked Questions
Can a Market’s Age or History Predict Its Weekly Foot Traffic Numbers?
Yes, it can. Older markets build loyal shopper habits over years. If a market’s been running 10-plus years, you’re likely looking at steadier weekly numbers than a market that launched recently.
How Does Weather Patterns Affect Foot Traffic Counts at Outdoor Markets?
Weather hits your numbers hard. Rain drops attendance by 30–50% at most outdoor markets. You’ll see your real baseline on clear, mild Saturdays. Don’t count opening day or festival weekends.
Should a New Vendor Test a Market Before Committing to a Full Season?
Yes, you should. Visit as a shopper first, then request a single-day vendor spot. Count transactions at nearby booths. Two test days give you real data before you sign a full season contract.
What Time of Day Does Foot Traffic Peak at Most Farmers Markets?
Most markets peak between 9 and 11 a.m. That’s when your best buyers show up. Plan to be fully set up by 8:45 so you don’t miss the rush.
Do Online Farmers Market Listings Accurately Reflect Current Vendor and Shopper Activity?
They don’t. Most listings are outdated by months or years. You’ll find closed markets still listed as active. Always call the market manager directly to confirm current vendor count and shopper numbers.
Leave a Reply