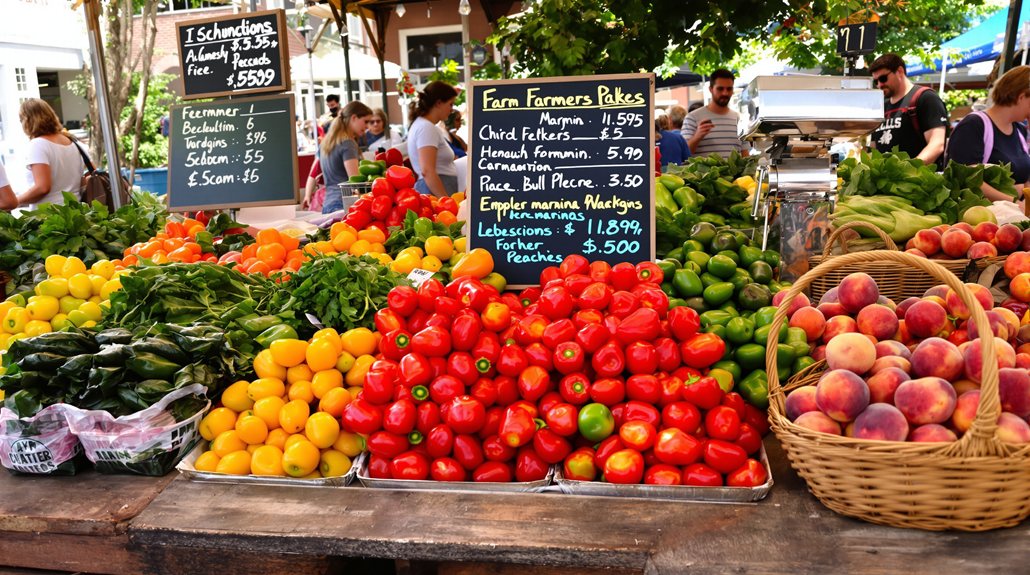
Standard vegetable vendors gross 40% to 60% at farmers markets. Specialty crop vendors—microgreens especially—gross 65% to 80%. On $500 in sales, that gap means keeping $200 versus $400. Microgreens have fewer competitors at most markets, which protects your pricing power. Your take-home isn’t determined by how much you sell—it’s determined by what you’re selling. The numbers behind each crop type reveal exactly where your model breaks down.
Key Takeaways
- Standard vegetable vendors typically gross 40%–60%, while specialty crops like microgreens reach 65%–80% margins.
- On $500 in sales, a 40% margin returns $200, while an 80% margin returns $400.
- Weekly costs averaging $240 against $800 gross revenue leave approximately $560 net per market day.
- A 20-week seasonal market window can generate $11,200 net before taxes at consistent weekly performance.
- Booth fees ($25–$75), fuel ($15–$40), and product loss (5%–15%) are predictable costs that directly compress margins.
What do produce vendor profit margins actually look like at a farmers market?
Standard vegetable vendors at farmers markets typically gross 40% to 60% on their products. Specialty crops like microgreens, heirloom varieties, and edible flowers push that number to 65% to 80%.
That gap isn’t small. It changes what you take home on a Saturday.
How standard vegetable margins compare to specialty crop margins
Most farmers market produce vendors work with gross margins between 40% and 60% on standard vegetables like tomatoes, peppers, and squash. That range is common, and it’s competitive.
Specialty crops run higher. Microgreens, heirloom varieties, and edible flowers typically land between 65% and 80% gross margin. Lower competition and perceived premium value drive that gap.
The microgreens profit margin at a farmers market sits at the top of that specialty crop range. You’re not fighting for space in a crowded category.
Standard vegetables take weeks or months to grow. Microgreens cycle in 7 to 14 days. That difference changes how much your growing space earns per square foot each month.
What the difference between 40% and 80% gross margin means in practice
Those margin numbers matter more when you put dollars behind them.
Say you sell $500 in produce at a farmers market Saturday. At a 40% gross margin, you keep $200. At 80%, you keep $400.
That’s a $200 difference on the same $500 in sales.
Microgreens sit in that 80% range. Standard vegetables sit closer to 40%. The produce vendor profit margin gap at a farmers market isn’t small.
Run that $200 difference across 20 market Saturdays. You’re looking at $4,000 more per season on identical revenue.
Same booth. Same table. Same customers.
The gap comes from what you grow, not how much you sell. Specialty crops built that advantage. You just have to choose them.
Why do specialty crops like microgreens command higher margins than standard produce?
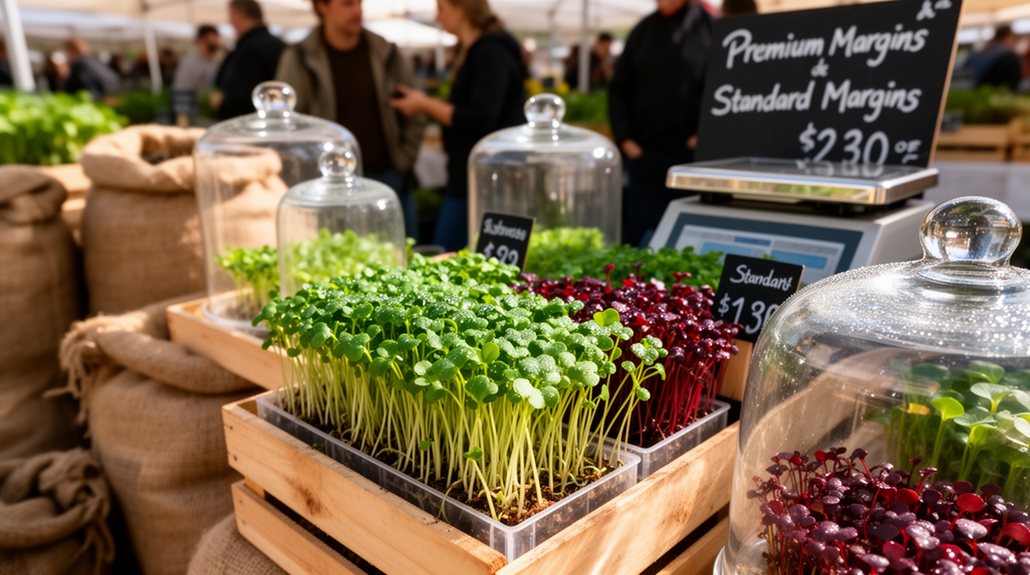
Buyers pay more for specialty greens because they can’t find them at every table.
Standard vegetables like tomatoes and lettuce show up at 10 different booths, so price competition drives margins down fast.
Microgreens sit in a different category.
Most markets have one specialty crop vendor or none at all, and that gap lets you set a price the product can actually hold.
What makes buyers willing to pay more for specialty greens than bulk vegetables
Scarcity drives price at farmers markets. When buyers scan a market and see 12 tomato vendors and one microgreens table, they stop at the one.
That’s not luck. It’s positioning.
Buyers pay more for what they can’t easily find. Specialty greens feel exclusive because they often are.
Most markets have under-representation in that category, according to Lee and Miller (2026).
Your microgreens revenue per square foot reflects that gap directly. You’re not competing on price. You’re competing on access.
Shoppers who regularly attend markets want to be part of a vendor community. They return to tables that carry products their regular grocery store doesn’t stock.
That loyalty is what sustains your numbers week over week.
How lower competition at most markets supports higher pricing on specialty crops
Market data backs up what loyalty signals. Lee and Miller found that 47.7% of specialty crop vendors primarily sell vegetables. That’s the most crowded lane at most markets.
Microgreens sit outside that lane. Most markets have zero dedicated microgreens vendors. That gap directly supports your specialty crop profit margin.
Standard vegetable vendors compete on price. You don’t have to. When you’re the only one selling sunflower shoots or pea tendrils, you set the price.
Specialty crops including microgreens typically command 65% to 80% gross margins. Standard vegetables run 40% to 60%. The difference isn’t luck. It’s low competition and perceived premium value working together.
How does crop cycle time affect profitability for produce vendors?
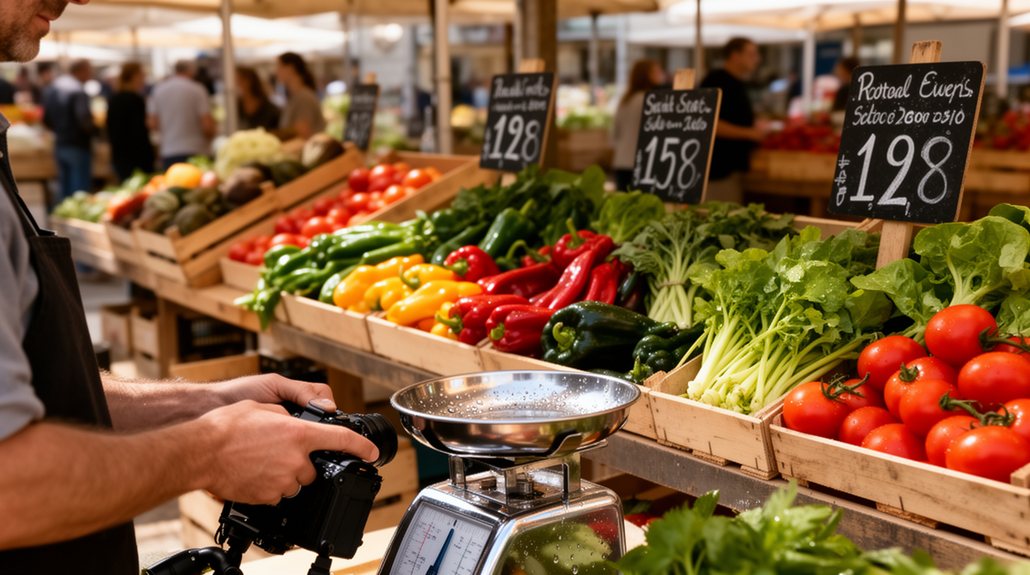
Crop cycle time directly controls how many times you can sell from the same square foot of growing space.
A 7 to 14 day microgreens cycle lets you reset and restock every single week.
Standard vegetables lock that same space up for weeks or months between harvests.
Why short-cycle crops produce better revenue per square foot than seasonal vegetables
Seasonal vegetables almost always tie up your growing space for weeks or months before you see a single dollar. Tomatoes take 60 to 80 days. Peppers take longer.
Microgreens take 7 to 14 days from seed to harvest. That same 10×10 foot space turns over multiple times per month.
More turns means more revenue from the same square footage. That’s the short cycle crop profit margin advantage. Growers who understand this stop thinking about what they can grow and start thinking about what each square foot earns.
Standard produce vendors work with 40% to 60% margins. Microgreens vendors typically see 65% to 80%. The difference is cycle time and space efficiency.
The MGW Farmers Market Finder has 7,842 USDA-verified markets searchable by zip code, city, or state. Use it to find and compare markets near you before you apply – markets.microgreensworld.com.
The Microgreens Growth Path Tool maps your first move using local market data – growthpath.microgreensworld.com.
What a 7 to 14 day grow cycle means for a farmers market vendor’s weekly inventory
With a 7 to 14 day grow cycle, you’re not waiting on the season. You’re resetting your inventory every week.
Plant sunflower shoots on Monday. Harvest by Friday. Sell Saturday morning.
That rhythm is what separates microgreens growing profit from standard produce margins. A tomato vendor waits 60 to 90 days per crop. You wait 10.
You can stagger trays by two or three days. That keeps your harvest window tight and your Saturday table full.
A 10×10 foot grow area produces enough for a full market day in one cycle. Most vegetable growers need 10 times the space to match that output.
Inventory control becomes the real advantage here. You grow to fill your table, not to fill a field.
What does a realistic profit and loss look like for a microgreens vendor at a seasonal market?
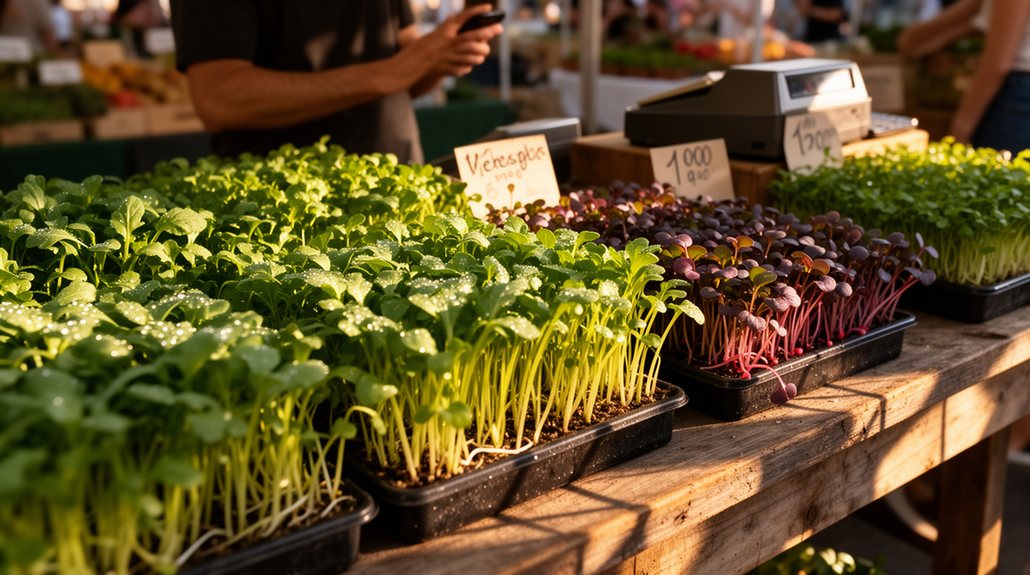
A 20-week seasonal market runs from roughly May through September in most regions.
You need exact numbers to know if it’s worth doing, and most profitability guides skip the costs that quietly kill your margin.
This section breaks down a real P&L, including the line items most vendors never see coming.
The numbers behind a typical 20-week market season for a specialty produce vendor
Twenty weeks is your operating window. Most seasonal markets run May through September. That’s your full farmers market produce vendor profit cycle.
Plan for $800 in weekly gross revenue. Over 20 weeks, that’s $16,000 total.
Subtract costs. Seed, trays, soil, and booth fees average $240 weekly at standard rates. That leaves $560 per week.
Your 20-week net lands around $11,200 before taxes.
Specialty crops like microgreens hold 65% to 80% gross margins. Standard vegetables hit 40% to 60%. The gap matters.
You’re not guessing here. These numbers reflect what vendors actually produce in a 10×10 grow space over one cycle.
Track every week. Week 8 tells you if you’re on pace or falling behind.
Where the hidden costs show up that most profitability guides skip
Those weekly numbers look clean on paper. But most profitability guides skip the costs that show up between market days.
Booth fees, packaging, and fuel eat into your margin fast.
| Hidden cost | Typical range |
|---|---|
| Market booth fee | $25 to $75 per week |
| Packaging (clamshells, bags) | $0.10 to $0.30 per unit |
| Fuel and transport | $15 to $40 per market day |
| Product loss (unsold trays) | 5% to 15% of gross |
These aren’t surprises. They’re predictable. Track them before your first market day, not after.
Other vendors in your market community already know these numbers. Ask them directly. That’s how you build the knowledge base that protects your margin.
How do you calculate your target margin and weekly revenue goal?
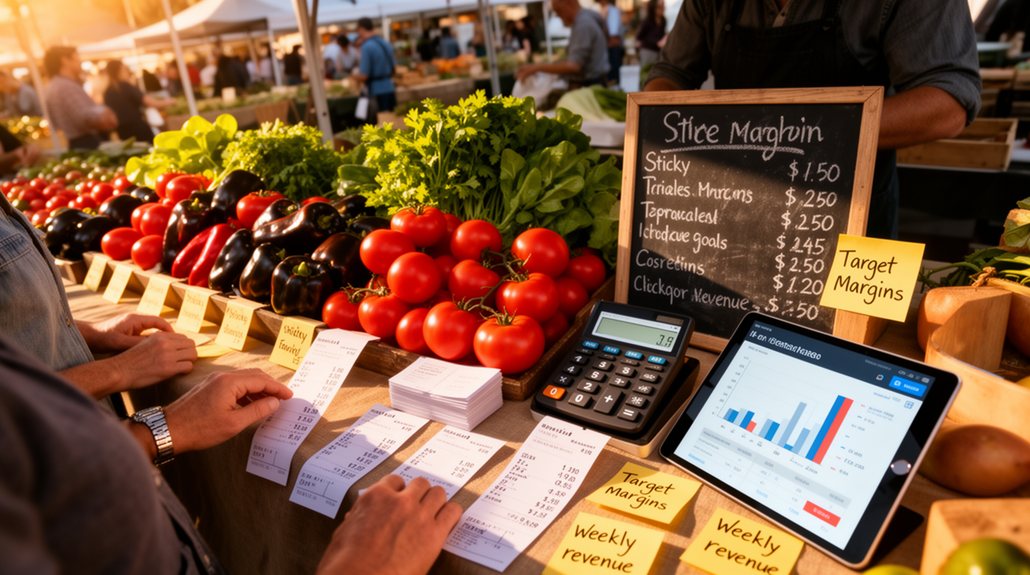
You need two numbers before anything else: your target margin and your weekly revenue goal.
Most produce vendors skip this step and guess. That gap between guessing and calculating is where profit gets lost.
What inputs matter most in a produce vendor profitability model
Start with your weekly revenue goal, not your crop list. Most farmers market produce vendor revenue problems start here. You pick crops first, then wonder why the money doesn’t work.
Set a number. Say $400 per Saturday.
Now work backward. If your gross margin is 70%, you need $120 in costs to generate that $400. That means your grow space, trays, seed, and labor all have to fit inside $120.
The inputs that matter most are margin percentage, cost per tray, average sale price per unit, and number of units sold.
Track those four numbers every market day. They tell you exactly where the model breaks before it costs you a full season.
How to use the Growth Path Tool to run your numbers for your specific market
Four inputs tell you what your market can support. Your booth cost, your crop cost, your target take-home, and your local market foot traffic.
The Growth Path Tool takes those four numbers. It outputs your produce vendor break even point and your weekly revenue goal for that specific farmers market.
Enter your zip code first. The tool pulls real market data for your area.
Then enter your weekly growing cost and booth fee. Set your take-home target.
The tool shows you how many trays or units you need to sell to hit break even at your farmers market. It also shows you the gap between where you’re and where you need to be.
The MGW Farmers Market Finder has 7,842 USDA-verified markets searchable by zip code, city, or state. Use it to find and compare markets near you before you apply – markets.microgreensworld.com.
The Microgreens Growth Path Tool maps your first move using local market data – growthpath.microgreensworld.com.
Frequently Asked Questions
Do Farmers Markets Charge Vendors a Percentage of Sales or Flat Fees?
Most farmers markets charge flat fees, not percentages. You’ll typically pay a daily or seasonal booth rate. It’s a fixed cost you can plan around before you sell a single item.
How Many Markets Should a New Microgreens Vendor Apply to at Once?
Start with one market. Apply to two if they’re on different days. You need to learn your setup, your pitch, and your margins before you stretch thin.
What Permits or Licenses Do Produce Vendors Typically Need at Farmers Markets?
You’ll need a business license, a state-issued cottage food or produce vendor permit, and a sales tax ID. Some states also require a food handler’s card. Check your county extension office first.
Can a Microgreens Vendor Make Consistent Sales in Winter Farmers Markets?
You can make consistent winter sales. Indoor markets run year-round in most cities. Microgreens grow in 7 to 14 days, so you’re never waiting on a season to restock.
How Much Table Space Does a Microgreens Vendor Need to Display Product?
You don’t need much. A 6-foot table handles most microgreens displays comfortably. Keep your trays tiered and your signage visible. Most vendors work the full table, but half works too.
Leave a Reply